404 Not Found

The following table shows the number of new employees added to different categories of employees in a company and also the number of employees from these categories who left the company every year since the foundation of the Company in 1995.
A 112
B 128
C 88
D 96
Share : | |||||||||||||||||||||||||||||||||||||||||||||||||||||||||||||||||||||||||||||||||||||||
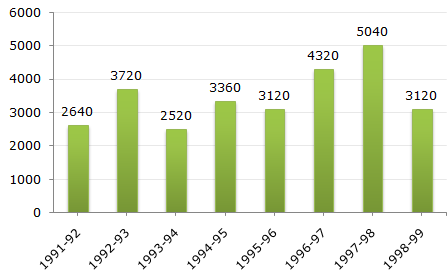
The bar graph given below shows the foreign exchange reserves of a country (in million US $) from 1991 - 1992 to 1998 - 1999. Foreign Exchange Reserves Of a Country. (in million US $)
A 95%
B
110%
C
115%
D
125%
Share : | |||||||||||||||||||||||||||||||||||||||||||||||||||||||||||||||||||||||||||||||||||||||
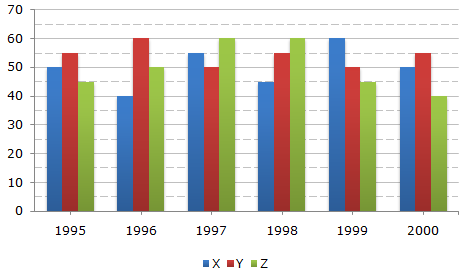
The bar graph given below shows the data of the production of paper (in lakh tonnes) by three different companies X, Y and Z over the years. Production of Paper (in lakh tonnes) by Three Companies X, Y and Z over the Years.
A 50%
B 30%
C 60%
D
45%
Share : | |||||||||||||||||||||||||||||||||||||||||||||||||||||||||||||||||||||||||||||||||||||||
The bar graph given below shows the data of the production of paper (in lakh tonnes) by three different companies X, Y and Z over the years. Production of Paper (in lakh tonnes) by Three Companies X, Y and Z over the Years.
A 2,00,00,000 tons
B
20,00,000 tons
C 2,00,000 tons
D 20,000 tons
Share : | |||||||||||||||||||||||||||||||||||||||||||||||||||||||||||||||||||||||||||||||||||||||
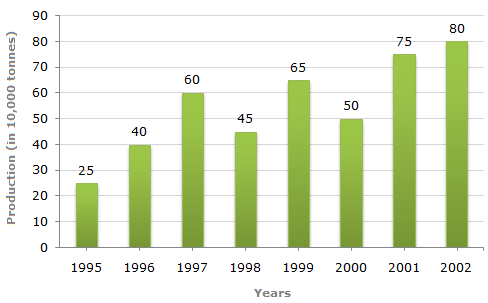
Study the bar chart and answer the question based on it. Production of Fertilizers by a Company (in 1000 tonnes) Over the Years
A
1995 and 2001
B
1998 and 2000
C 2000 and 2001
D 1999 and 2000
Share : | |||||||||||||||||||||||||||||||||||||||||||||||||||||||||||||||||||||||||||||||||||||||
A soft drink company prepares drinks of three different flavours - X, Y and Z. The production of three flavours over a period of six years has been expressed in the bar graph provided below. Production of Three Different Flavours X, Y and Z by a Company over the years (in lakh bottles)
A
115.57%
B
96.67%
C
102.25%
D
133.33%
Share : | |||||||||||||||||||||||||||||||||||||||||||||||||||||||||||||||||||||||||||||||||||||||
A soft drink company prepares drinks of three different flavours - X, Y and Z. The production of three flavours over a period of six years has been expressed in the bar graph provided below. Production of Three Different Flavours X, Y and Z by a Company over the years (in lakh bottles)
A 5,00,000 bottles
B
2,40,000 bottles
C
80,000 bottles
D
50,000 bottles
Share : | |||||||||||||||||||||||||||||||||||||||||||||||||||||||||||||||||||||||||||||||||||||||
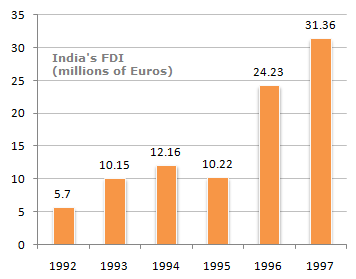
The following bar chart shows the trends of foreign direct investments(FDI) into India from all over the world. Trends of FDI in India
A 8.13
B 7.29
C
7.13
D None of these
Share : | |||||||||||||||||||||||||||||||||||||||||||||||||||||||||||||||||||||||||||||||||||||||
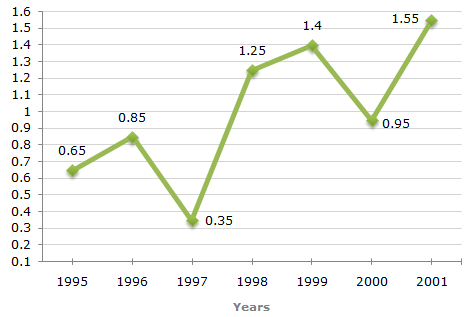
The following line graph gives the ratio of the amounts of imports by a company to the amount of exports from that company over the period from 1995 to 2001. Ratio of Value of Imports to Exports by a Company Over the Years.
A
Rs. 280 crores
B
Rs. 320 crores
C Rs. 275 crores
D Rs. 370 crores
Share : | |||||||||||||||||||||||||||||||||||||||||||||||||||||||||||||||||||||||||||||||||||||||
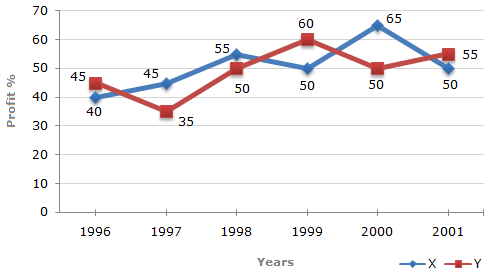
The following line graph gives the percent profit earned by two Companies X and Y during the period 1996 - 2001. Percentage profit earned by Two Companies X and Y over the Given Years
A Rs. 240 crores
B
Rs. 120 crores
C
Rs. 102 crores
D
Rs. 171 crores
Share : | |||||||||||||||||||||||||||||||||||||||||||||||||||||||||||||||||||||||||||||||||||||||

![]](/_files/images/data-interpretation/common/15-sym-cbracket-h1.gif)
 Required percentage =

 125%.
125%.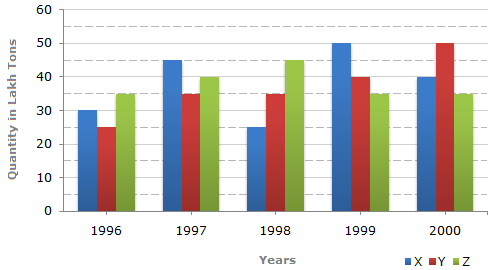
 x =
x =