404 Not Found

Study the following table and answer the questions. Number of Candidates Appeared and Qualified in a Competitive Examination from Different States Over the Years.
A 72%
B 80%
C 83%
D 77%
Share : | |||||||||||||||||||||||||||||||||||||||||||||||||||||||||||||||||||||||||||||||||||||||||||||||||||||||||||||||
Study the following table and answer the questions based on it. Number of Candidates Appeared, Qualified and Selected in a Competitive Examination from Five States Delhi, H.P, U.P, Punjab and Haryana Over the Years 1994 to 1998
A Punjab
B
Delhi
C
U.P
D
H.P
Share : | |||||||||||||||||||||||||||||||||||||||||||||||||||||||||||||||||||||||||||||||||||||||||||||||||||||||||||||||
The following table gives the sales of batteries manufactured by a company over the years. Number of Different Types of Batteries Sold by a Company Over the Years (Numbers in Thousands)
A 39000
B 24000
C
35000
D
28000
Share : | |||||||||||||||||||||||||||||||||||||||||||||||||||||||||||||||||||||||||||||||||||||||||||||||||||||||||||||||
The following table gives the sales of batteries manufactured by a company over the years. Number of Different Types of Batteries Sold by a Company Over the Years (Numbers in Thousands)
A
7AH
B 35AH
C
32AH
D
4AH
Share : | |||||||||||||||||||||||||||||||||||||||||||||||||||||||||||||||||||||||||||||||||||||||||||||||||||||||||||||||
The following table shows the number of new employees added to different categories of employees in a company and also the number of employees from these categories who left the company every year since the foundation of the Company in 1995.
A
1325
B 1195
C 1235
D 1265
Share : | |||||||||||||||||||||||||||||||||||||||||||||||||||||||||||||||||||||||||||||||||||||||||||||||||||||||||||||||
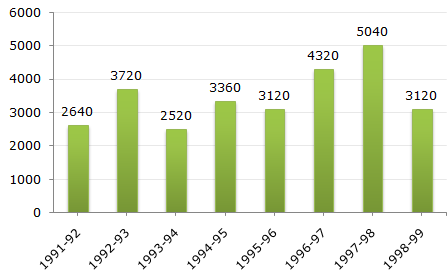
The bar graph given below shows the foreign exchange reserves of a country (in million US $) from 1991 - 1992 to 1998 - 1999. Foreign Exchange Reserves Of a Country. (in million US $)
A 1.2
B
0.7
C
1.4
D
1.5
Share : | |||||||||||||||||||||||||||||||||||||||||||||||||||||||||||||||||||||||||||||||||||||||||||||||||||||||||||||||
The bar graph given below shows the foreign exchange reserves of a country (in million US $) from 1991 - 1992 to 1998 - 1999. Foreign Exchange Reserves Of a Country. (in million US $)
A 100
B 620
C 200
D 150
Share : | |||||||||||||||||||||||||||||||||||||||||||||||||||||||||||||||||||||||||||||||||||||||||||||||||||||||||||||||
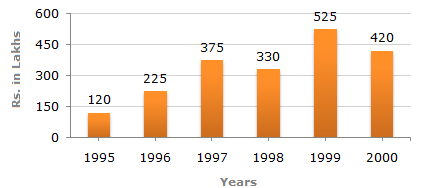
Out of the two bar graphs provided below, one shows the amounts (in Lakh Rs.) invested by a Company in purchasing raw materials over the years and the other shows the values (in Lakh Rs.) of finished goods sold by the Company over the years. Amount invested in Raw Materials (Rs. in Lakhs)
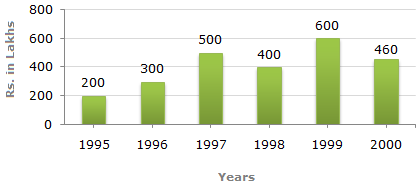
Value of Sales of Finished Goods (Rs. in Lakhs)
A 33%
B 37%
C 45%
D 49%
Share : | |||||||||||||||||||||||||||||||||||||||||||||||||||||||||||||||||||||||||||||||||||||||||||||||||||||||||||||||
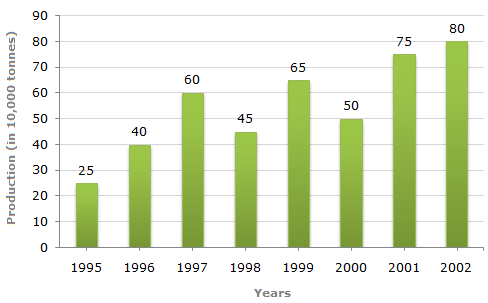
Study the bar chart and answer the question based on it. Production of Fertilizers by a Company (in 1000 tonnes) Over the Years
A
33(1/3)%
B 20%
C 25%
D
21%
Share : | |||||||||||||||||||||||||||||||||||||||||||||||||||||||||||||||||||||||||||||||||||||||||||||||||||||||||||||||
Study the bar chart and answer the question based on it. Production of Fertilizers by a Company (in 1000 tonnes) Over the Years
A
1998 and 2000
B 1999 and 2000
C 2000 and 2001
D
1995 and 2001
Share : | |||||||||||||||||||||||||||||||||||||||||||||||||||||||||||||||||||||||||||||||||||||||||||||||||||||||||||||||

![]](/_files/images/data-interpretation/common/15-sym-cbracket-h1.gif)
 80%.
80%.

 Pooled average of all the five categories of employees working in the Company in 1997