


404 Not Found

A
2nd, 9th, 16th, 23rd, 30th
B 1st, 8th, 15th, 22nd, 29th
C 3rd, 10th, 17th, 24th
D
4th, 11th, 18th, 25th
Share : | |||||||||||||||||||||||||||||||||||||||||||||||||||||||||||||||||||||||||||||||||||||||||||||||||
A 2011
B 2012
C 2013
D 2010
Share : | |||||||||||||||||||||||||||||||||||||||||||||||||||||||||||||||||||||||||||||||||||||||||||||||||
Study the following table and answer the questions based on it. Expenditures of a Company (in Lakh Rupees) per Annum Over the given Years.
| |||||||||||||||||||||||||||||||||||||||||||||||||||||||||||||||||||||||||||||||||||||||||||||||||
 0 odd days.
Total number of odd days = (0 + 0 + 0) = 0
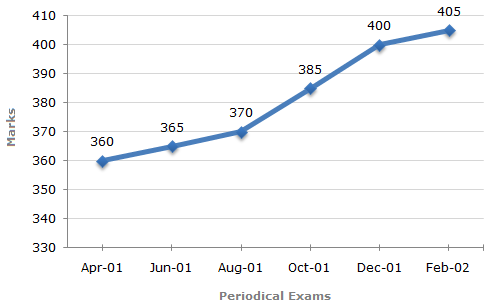
On 1st April, 2001 it was Sunday.
In April, 2001 Wednesday falls on 4th, 11th, 18th and 25th.
0 odd days.
Total number of odd days = (0 + 0 + 0) = 0
On 1st April, 2001 it was Sunday.
In April, 2001 Wednesday falls on 4th, 11th, 18th and 25th.
 0.25
0.25
| Then, 35 = | x - 220 | x 100  x = 297. x = 297. |
| 220 |
| E1 | = |
|
= | 3 x 150 | = | 15 | (Required ratio). | |||||
| E2 |
|
4 x 165 | 22 |
| 65 = | 3x - E1 | x 100 |
65 | = | 3x | - 1 E1 = 3x x |
 |
100 |  |
.... (i) |
| E1 | 100 | E1 | 165 |
| 50 = | 4x - E2 | x 100 |
50 | = | 4x | - 1 E2 = 4x x |
|
100 | |
.... (ii) |
| E2 | 100 | E2 | 150 |
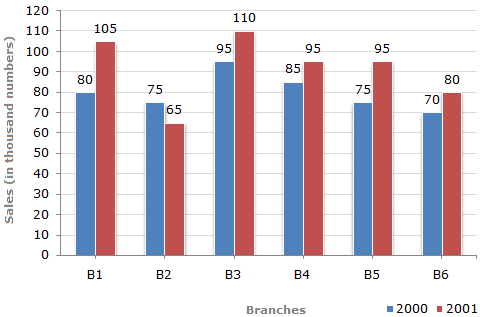
The bar graph given below shows the sales of books (in thousand number) from six branches of a publishing company during two consecutive years 2000 and 2001.
Sales of Books (in thousand numbers) from Six Branches - B1, B2, B3, B4, B5 and B6 of a publishing Company in 2000 and 2001.
 Required percentage =
![]](/_files/images/data-interpretation/common/15-sym-cbracket-h1.gif)
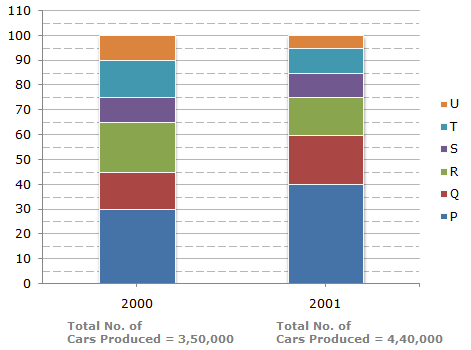
The bar graph given below shows the percentage distribution of the total production of a car manufacturing company into various models over two years.
Percentage of Six different types of Cars manufactured by a Company over Two Years
The bar graph given below shows the percentage distribution of the total production of a car manufacturing company into various models over two years.
Percentage of Six different types of Cars manufactured by a Company over Two Years
The bar graph given below shows the percentage distribution of the total production of a car manufacturing company into various models over two years.
Percentage of Six different types of Cars manufactured by a Company over Two Years
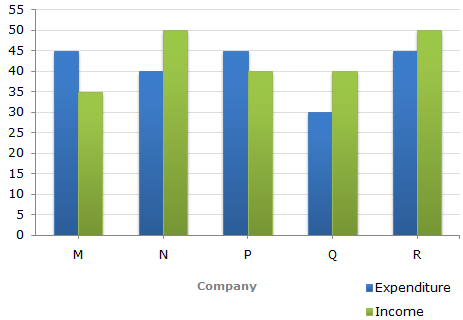
The following bar graph shows the Income and Expenditures (in million US $) of five companies in the year 2001. The percent profit or loss of a company is given by
| % Profit/Loss = | Income - Expenditure | x 100 |
| Expenditure |
Income and Expenditure (in million US $) of five companies in the year 2001.
 5%.
5%.The following bar graph shows the Income and Expenditures (in million US $) of five companies in the year 2001. The percent profit or loss of a company is given by
| % Profit/Loss = | Income - Expenditure | x 100 |
| Expenditure |
Income and Expenditure (in million US $) of five companies in the year 2001.
The following bar graph shows the Income and Expenditures (in million US $) of five companies in the year 2001. The percent profit or loss of a company is given by
| % Profit/Loss = | Income - Expenditure | x 100 |
| Expenditure |
Income and Expenditure (in million US $) of five companies in the year 2001.
 %Profit in 2000 = 10%]