404 Not Found

Study the following table and answer the questions based on it. Expenditures of a Company (in Lakh Rupees) per Annum Over the given Years.
| |||||||||||||||||||||||||||||||||||||||||||||||||||||||||||||||||||||||||||||||||||||||||||||||||
| E1 | = |
|
= | 3 x 150 | = | 15 | (Required ratio). | |||||
| E2 |
|
4 x 165 | 22 |
| Then, 35 = | x - 220 | x 100  x = 297. x = 297. |
| 220 |
| 65 = | 3x - E1 | x 100 |
65 | = | 3x | - 1 E1 = 3x x |
 |
100 |  |
.... (i) |
| E1 | 100 | E1 | 165 |
| 50 = | 4x - E2 | x 100 |
50 | = | 4x | - 1 E2 = 4x x |
|
100 | |
.... (ii) |
| E2 | 100 | E2 | 150 |
Study the following table and answer the questions based on it.
Expenditures of a Company (in Lakh Rupees) per Annum Over the given Years.
| Year | Item of Expenditure | ||||
| Salary | Fuel and Transport | Bonus | Interest on Loans | Taxes | |
| 1998 | 288 | 98 | 3.00 | 23.4 | 83 |
| 1999 | 342 | 112 | 2.52 | 32.5 | 108 |
| 2000 | 324 | 101 | 3.84 | 41.6 | 74 |
| 2001 | 336 | 133 | 3.68 | 36.4 | 88 |
| 2002 | 420 | 142 | 3.96 | 49.4 | 98 |

![]](/_files/images/data-interpretation/common/15-sym-cbracket-h1.gif)
 69.45%.
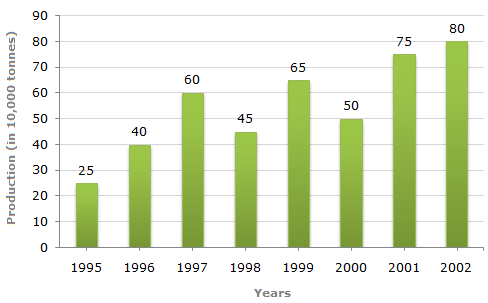
Study the bar chart and answer the question based on it.
Production of Fertilizers by a Company (in 1000 tonnes) Over the Years
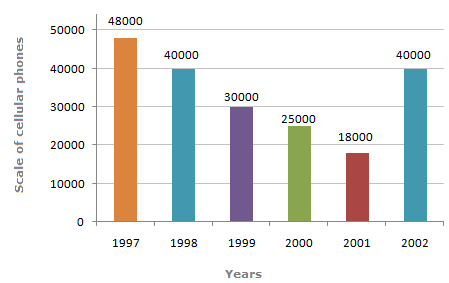
Study the bar chart and answer the questions.
Sale of Cellular Phones
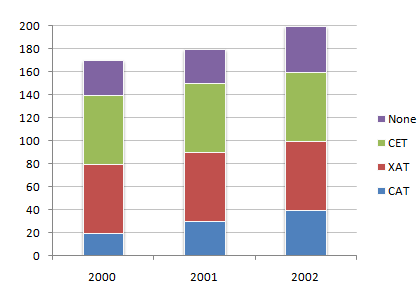
The following chart represents the number of students who passed the CAT exam or the XAT exam or the CET exam or None of these exams. (Assume that there are no students who passed more than one exam.)
Number of students who qualified CAT/XAT/CET Exams
Study the following bar chart and answer the questions carefully.
Sales Turnover of 5 Companies (in Rs. crores)
Study the following bar chart and answer the questions carefully.
Sales Turnover of 5 Companies (in Rs. crores)
Study the following bar chart and answer the questions carefully.
Sales Turnover of 5 Companies (in Rs. crores)
Study the following bar chart and answer the questions carefully.
Sales Turnover of 5 Companies (in Rs. crores)
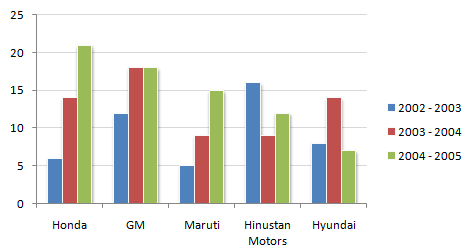
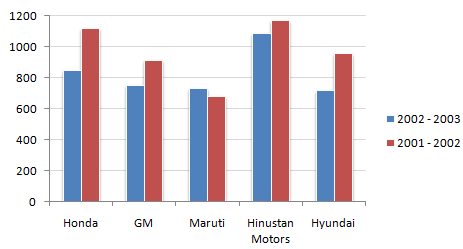
The following chart shows the production of cars in thousands.
Production of Cars for 2002 - 2005 period from the Selected Manufacturers