


Automatic Control Systems - Engineering
Q1:
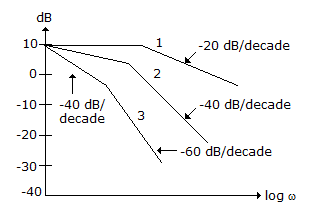
43. The given figure shows dB magnitude plots for type 0, type 1 and type 2 systems. Out of these
 A
curves 1, 2, 3 are for type 0, 1, 2 systems respectively
B
curves 1, 2, 3 are for type 2, 1, 0 systems respectively
C
curves 1, 2, 3 are for type 1, 0, 2 systems respectively
D
curves 1, 2, 3 are for type 1, 2, 0 systems respectively
ANS:A - curves 1, 2, 3 are for type 0, 1, 2 systems respectively No answer description is available. Share : |

