- Networks Analysis and Synthesis - Section 1
- Networks Analysis and Synthesis - Section 2
- Networks Analysis and Synthesis - Section 3
- Networks Analysis and Synthesis - Section 4
- Networks Analysis and Synthesis - Section 5
- Networks Analysis and Synthesis - Section 6
- Networks Analysis and Synthesis - Section 7
- Networks Analysis and Synthesis - Section 8
- Networks Analysis and Synthesis - Section 9
- Networks Analysis and Synthesis - Section 10
- Networks Analysis and Synthesis - Section 11
- Networks Analysis and Synthesis - Section 12
- Networks Analysis and Synthesis - Section 13
- Networks Analysis and Synthesis - Section 14
- Networks Analysis and Synthesis - Section 15
- Networks Analysis and Synthesis - Section 16
- Networks Analysis and Synthesis - Section 17
- Networks Analysis and Synthesis - Section 18
- Networks Analysis and Synthesis - Section 19
- Networks Analysis and Synthesis - Section 20
- Networks Analysis and Synthesis - Section 21
- Networks Analysis and Synthesis - Section 22
- Networks Analysis and Synthesis - Section 23
- Networks Analysis and Synthesis - Section 24
- Networks Analysis and Synthesis - Section 25
- Networks Analysis and Synthesis - Section 26
- Networks Analysis and Synthesis - Section 27


Networks Analysis and Synthesis - Engineering
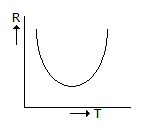
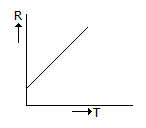
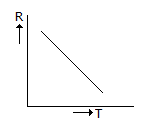
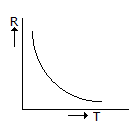
Q1: Which of the under-given graphs shown in figure gives variation in resistance of a copper conductor with temperature?A  B  C  D  ANS:B - No answer description is available. |


For help Students Orientation
Mcqs Questions
One stop destination for examination, preparation, recruitment, and more. Specially designed online test to solve all your preparation worries. Go wherever you want to and practice whenever you want, using the online test platform.

