404 Not Found

The following table shows the number of new employees added to different categories of employees in a company and also the number of employees from these categories who left the company every year since the foundation of the Company in 1995.
A Managers
B
Operators
C
Technicians
D Accountants
Share : | |||||||||||||||||||||||||||||||||||||||||||||||||||||||||||||||||||||||||||||||||||||||
The following table shows the number of new employees added to different categories of employees in a company and also the number of employees from these categories who left the company every year since the foundation of the Company in 1995.
A 21%
B
27%
C 19%
D 29%
Share : | |||||||||||||||||||||||||||||||||||||||||||||||||||||||||||||||||||||||||||||||||||||||
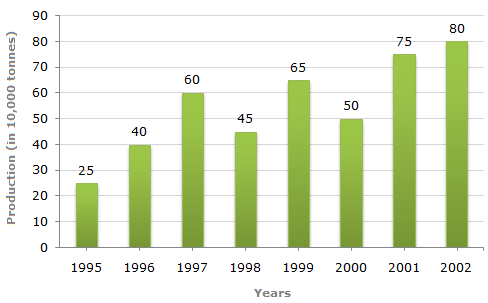
Study the bar chart and answer the question based on it. Production of Fertilizers by a Company (in 1000 tonnes) Over the Years
A 320%
B
220%
C 200%
D
300%
Share : | |||||||||||||||||||||||||||||||||||||||||||||||||||||||||||||||||||||||||||||||||||||||
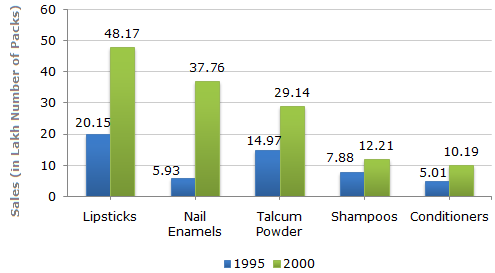
A cosmetic company provides five different products. The sales of these five products (in lakh number of packs) during 1995 and 2000 are shown in the following bar graph. Sales (in lakh number of packs) of five different products of Cosmetic Company during 1995 and 2000
A Shampoos
B Lipsticks
C Talcum powders
D
Nail enamels
Share : | |||||||||||||||||||||||||||||||||||||||||||||||||||||||||||||||||||||||||||||||||||||||
A cosmetic company provides five different products. The sales of these five products (in lakh number of packs) during 1995 and 2000 are shown in the following bar graph. Sales (in lakh number of packs) of five different products of Cosmetic Company during 1995 and 2000
A
7:2
B
2:1
C
5:2
D 4:3
Share : | |||||||||||||||||||||||||||||||||||||||||||||||||||||||||||||||||||||||||||||||||||||||
A cosmetic company provides five different products. The sales of these five products (in lakh number of packs) during 1995 and 2000 are shown in the following bar graph. Sales (in lakh number of packs) of five different products of Cosmetic Company during 1995 and 2000
A Talcum powders
B
Lipsticks
C
Nail enamels
D Shampoos
Share : | |||||||||||||||||||||||||||||||||||||||||||||||||||||||||||||||||||||||||||||||||||||||
A cosmetic company provides five different products. The sales of these five products (in lakh number of packs) during 1995 and 2000 are shown in the following bar graph. Sales (in lakh number of packs) of five different products of Cosmetic Company during 1995 and 2000
A
57%
B 25%
C
36%
D 29%
Share : | |||||||||||||||||||||||||||||||||||||||||||||||||||||||||||||||||||||||||||||||||||||||
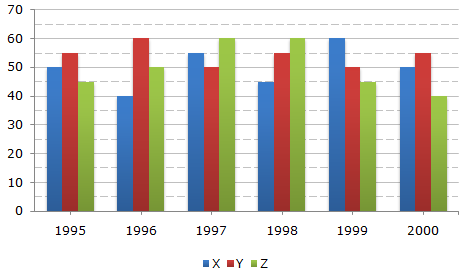
A soft drink company prepares drinks of three different flavours - X, Y and Z. The production of three flavours over a period of six years has been expressed in the bar graph provided below. Production of Three Different Flavours X, Y and Z by a Company over the years (in lakh bottles)
A
96.67%
B
102.25%
C
133.33%
D
115.57%
Share : | |||||||||||||||||||||||||||||||||||||||||||||||||||||||||||||||||||||||||||||||||||||||
A soft drink company prepares drinks of three different flavours - X, Y and Z. The production of three flavours over a period of six years has been expressed in the bar graph provided below. Production of Three Different Flavours X, Y and Z by a Company over the years (in lakh bottles)
A
50,000 bottles
B 5,00,000 bottles
C
2,40,000 bottles
D
80,000 bottles
Share : | |||||||||||||||||||||||||||||||||||||||||||||||||||||||||||||||||||||||||||||||||||||||
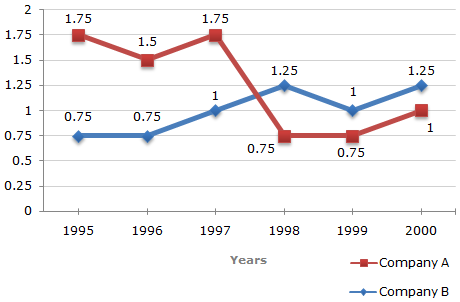
Answer the questions based on the given line graph. Ratio of Exports to Imports (in terms of money in Rs. crores) of Two Companies Over the Years
A
Cannot be determined
B Rs. 210 crores
C
Rs. 225 crores
D
Rs. 190 crores
Share : | |||||||||||||||||||||||||||||||||||||||||||||||||||||||||||||||||||||||||||||||||||||||
 Percentage increase in the number of Managers

![]](/_files/images/data-interpretation/common/15-sym-cbracket-h1.gif)


 29%.
29%.