404 Not Found

A Tuesday
B Monday
C Thursday
D
Wednesday
Share : | ||||||||||||||||||||||||||||||||||||||||||||||||||||||||||||||||||||||||||||||||||||||
Study the following table and answer the questions based on it. Expenditures of a Company (in Lakh Rupees) per Annum Over the given Years.
A 62%
B 69%
C 66%
D 71%
Share : | ||||||||||||||||||||||||||||||||||||||||||||||||||||||||||||||||||||||||||||||||||||||
Study the following table and answer the questions. Number of Candidates Appeared and Qualified in a Competitive Examination from Different States Over the Years.
A 72%
B 80%
C 83%
D 77%
Share : | ||||||||||||||||||||||||||||||||||||||||||||||||||||||||||||||||||||||||||||||||||||||
Study the following table and answer the questions. Number of Candidates Appeared and Qualified in a Competitive Examination from Different States Over the Years.
A 10.87%
B 11.49%
C 12.54%
D 12.35%
Share : | ||||||||||||||||||||||||||||||||||||||||||||||||||||||||||||||||||||||||||||||||||||||
The following table gives the sales of batteries manufactured by a company over the years. Number of Different Types of Batteries Sold by a Company Over the Years (Numbers in Thousands)
A 28%
B 34%
C 31%
D 33%
Share : | ||||||||||||||||||||||||||||||||||||||||||||||||||||||||||||||||||||||||||||||||||||||
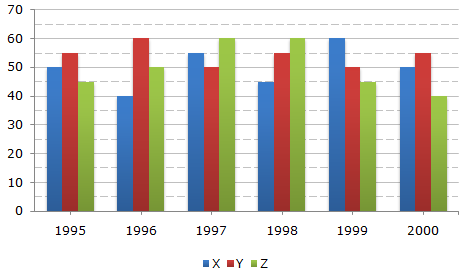
The bar graph given below shows the data of the production of paper (in lakh tonnes) by three different companies X, Y and Z over the years. Production of Paper (in lakh tonnes) by Three Companies X, Y and Z over the Years.
A
1:1
B
27:29
C 23:25
D 15:17
Share : | ||||||||||||||||||||||||||||||||||||||||||||||||||||||||||||||||||||||||||||||||||||||
The bar graph given below shows the data of the production of paper (in lakh tonnes) by three different companies X, Y and Z over the years. Production of Paper (in lakh tonnes) by Three Companies X, Y and Z over the Years.
A 2,00,000 tons
B 20,000 tons
C
20,00,000 tons
D 2,00,00,000 tons
Share : | ||||||||||||||||||||||||||||||||||||||||||||||||||||||||||||||||||||||||||||||||||||||
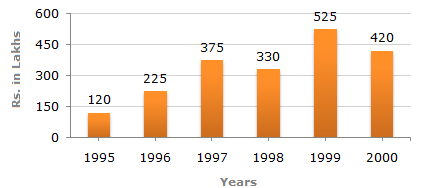
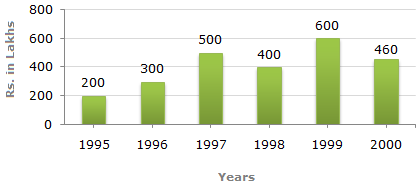
Out of the two bar graphs provided below, one shows the amounts (in Lakh Rs.) invested by a Company in purchasing raw materials over the years and the other shows the values (in Lakh Rs.) of finished goods sold by the Company over the years. Amount invested in Raw Materials (Rs. in Lakhs)
Value of Sales of Finished Goods (Rs. in Lakhs)
A 33%
B 37%
C 49%
D 45%
Share : | ||||||||||||||||||||||||||||||||||||||||||||||||||||||||||||||||||||||||||||||||||||||
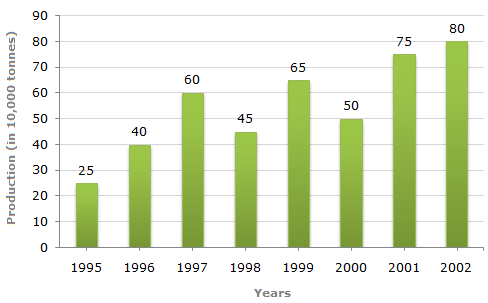
Study the bar chart and answer the question based on it. Production of Fertilizers by a Company (in 1000 tonnes) Over the Years
A
33(1/3)%
B
21%
C 20%
D 25%
Share : | ||||||||||||||||||||||||||||||||||||||||||||||||||||||||||||||||||||||||||||||||||||||
A soft drink company prepares drinks of three different flavours - X, Y and Z. The production of three flavours over a period of six years has been expressed in the bar graph provided below. Production of Three Different Flavours X, Y and Z by a Company over the years (in lakh bottles)
A
102.25%
B
133.33%
C
96.67%
D
115.57%
Share : | ||||||||||||||||||||||||||||||||||||||||||||||||||||||||||||||||||||||||||||||||||||||
 168 days = 24 weeks = 0 odd day.
Total number of odd days = (0 + 1 + 2 + 0) = 3.
Given day is Wednesday.
168 days = 24 weeks = 0 odd day.
Total number of odd days = (0 + 1 + 2 + 0) = 3.
Given day is Wednesday.

![]](/_files/images/data-interpretation/common/15-sym-cbracket-h1.gif)
 69.45%.
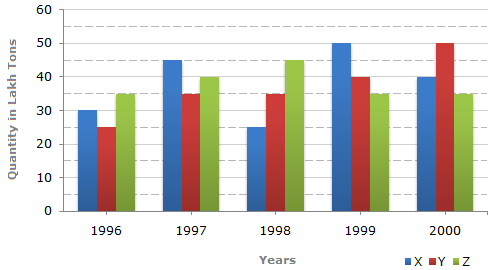


 Required ratio =