- Bar Charts - Bar Chart 1
- Bar Charts - Bar Chart 2
- Bar Charts - Bar Chart 3
- Bar Charts - Bar Chart 4
- Bar Charts - Bar Chart 5
- Bar Charts - Bar Chart 6
- Bar Charts - Bar Chart 7
- Bar Charts - Bar Chart 8
- Bar Charts - Bar Chart 9
- Bar Charts - Bar Chart 10
- Bar Charts - Bar Chart 11
- Bar Charts - Bar Chart 12
- Bar Charts - Bar Chart 13
- Bar Charts - Bar Chart 14
- Bar Charts - Bar Chart 15
- Bar Charts - Bar Chart 16
- Bar Charts - Bar Chart 17
- Bar Charts - Bar Chart 18
- Bar Charts - Bar Chart 19


Bar Charts - General Aptitude
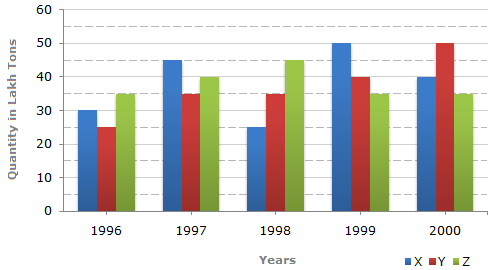
The bar graph given below shows the data of the production of paper (in lakh tonnes) by three different companies X, Y and Z over the years.
Production of Paper (in lakh tonnes) by Three Companies X, Y and Z over the Years.
Q1: What is the ratio of the average production of Company X in the period 1998-2000 to the average production of Company Y in the same period?A
1:1
B 15:17
C 23:25
D
27:29
ANS:C - 23:25 Average production of Company X in the period 1998-2000
|


For help Students Orientation
Mcqs Questions
One stop destination for examination, preparation, recruitment, and more. Specially designed online test to solve all your preparation worries. Go wherever you want to and practice whenever you want, using the online test platform.