Bar Charts - ( 
 Data Interpretation)


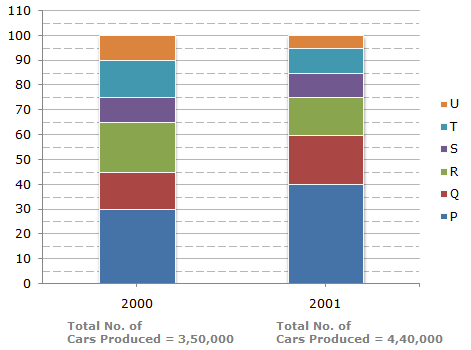
                                The bar graph given below shows the percentage distribution of the total production of a car manufacturing company into various models over two years.    
                                            
                                        Percentage of Six different types of Cars manufactured by a Company over Two Years
                               
 ![]()  |  
            
                            
                                    For help Students Orientation 
                                    Mcqs Questions
                                
                                One stop destination for examination, preparation, recruitment, and more. Specially designed online test to solve all your preparation worries. Go wherever you want to and practice whenever you want, using the online test platform.
                            
