Bar Charts - ( 
 Data Interpretation)


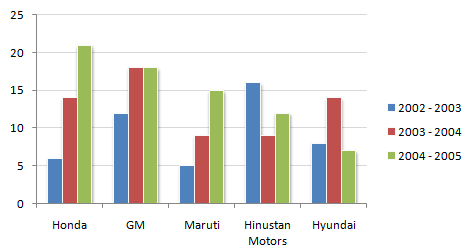
                                The following chart shows the production of cars in thousands.
                                            
                                        Production of Cars for 2002 - 2005 period from the Selected Manufacturers
                                 
 ![]()  |  
            
                            
                                    For help Students Orientation 
                                    Mcqs Questions
                                
                                One stop destination for examination, preparation, recruitment, and more. Specially designed online test to solve all your preparation worries. Go wherever you want to and practice whenever you want, using the online test platform.
                            
