


Line Charts - (  Data Interpretation)
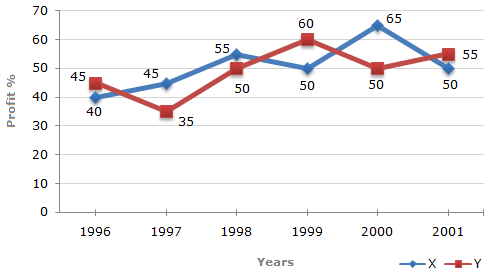
The following line graph gives the percent profit earned by two Companies X and Y during the period 1996 - 2001.
Percentage profit earned by Two Companies X and Y over the Given Years
| %Profit = | Income - Expenditure | x 100 |
| Expenditure |
 |

