- Line Charts - Line Chart 1
- Line Charts - Line Chart 2
- Line Charts - Line Chart 3
- Line Charts - Line Chart 4
- Line Charts - Line Chart 5
- Line Charts - Line Chart 6
- Line Charts - Line Chart 7
- Line Charts - Line Chart 8
- Line Charts - Line Chart 9
- Line Charts - Line Chart 10


Line Charts - (
Data Interpretation)
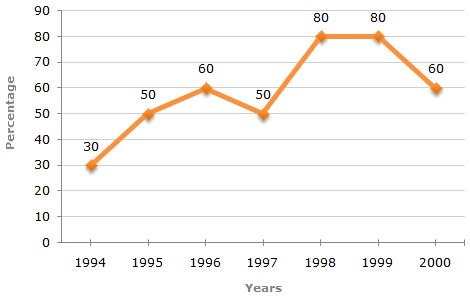
The following line graph gives the percentage of the number of candidates who qualified an examination out of the total number of candidates who appeared for the examination over a period of seven years from 1994 to 2000.
Percentage of Candidates Qualified to Appeared in an Examination Over the Years
![]() |


For help Students Orientation
Mcqs Questions
One stop destination for examination, preparation, recruitment, and more. Specially designed online test to solve all your preparation worries. Go wherever you want to and practice whenever you want, using the online test platform.