- Pie Charts - Pie Chart 1
- Pie Charts - Pie Chart 2
- Pie Charts - Pie Chart 3
- Pie Charts - Pie Chart 4
- Pie Charts - Pie Chart 5
- Pie Charts - Pie Chart 6
- Pie Charts - Pie Chart 7
- Pie Charts - Pie Chart 8
- Pie Charts - Pie Chart 9
- Pie Charts - Pie Chart 10
- Pie Charts - Pie Chart 11
- Pie Charts - Pie Chart 12


Pie Charts - (
Data Interpretation)
Study the following graph and the table and answer the questions given below.
Data of different states regarding population of states in the year 1998
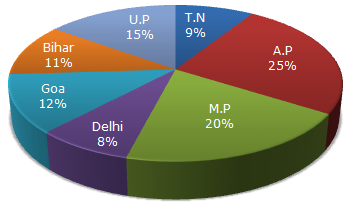
Total population of the given States = 3276000.
States | Sex and Literacy wise Population Ratio | |||
Sex | Literacy | |||
M | F | Literate | Illiterate | |
A.P | 5 | 3 | 2 | 7 |
M.P | 3 | 1 | 1 | 4 |
Delhi | 2 | 3 | 2 | 1 |
Goa | 3 | 5 | 3 | 2 |
Bihar | 3 | 4 | 4 | 1 |
U.P. | 3 | 2 | 7 | 2 |
T.N. | 3 | 4 | 9 | 4 |
![]() |


For help Students Orientation
Mcqs Questions
One stop destination for examination, preparation, recruitment, and more. Specially designed online test to solve all your preparation worries. Go wherever you want to and practice whenever you want, using the online test platform.