


Pie Charts - (  Data Interpretation)
Study the following pie-chart and the table and answer the questions based on them.
Proportion of Population of Seven Villages in 1997
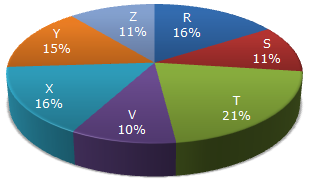
| Village | % Population Below Poverty Line |
| X | 38 |
| Y | 52 |
| Z | 42 |
| R | 51 |
| S | 49 |
| T | 46 |
| V | 58 |
 |

