


Line Charts - General Aptitude
Study the following line graph and answer the questions.
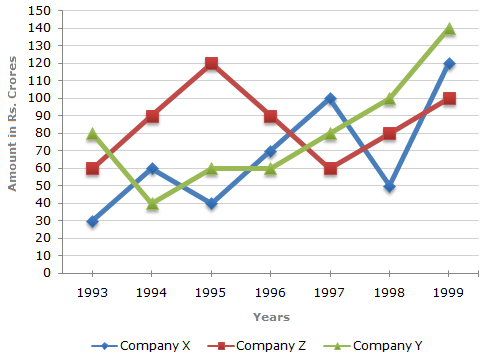
Exports from Three Companies Over the Years (in Rs. crore)
A
87.12%
B 89.64%
C
91.21%
D
93.33%
ANS:D - 93.33% Analysis of the graph: From the graph it is clear that
Share : |


 Required percentage =
![]](/_files/images/data-interpretation/common/15-sym-cbracket-h3.gif)
 93.33%.
