


Bar Charts - General Aptitude
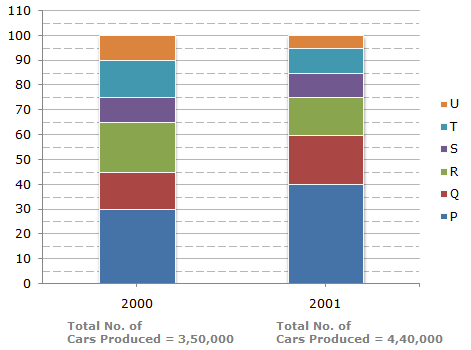
The bar graph given below shows the percentage distribution of the total production of a car manufacturing company into various models over two years.
Percentage of Six different types of Cars manufactured by a Company over Two Years
A Q
B R
C S
D T
ANS:B - R The percentage change (rise/fall) in production from 2000 to 2001 for various models is:
 Minimum percentage rise/fall is production is the case of model R. Minimum percentage rise/fall is production is the case of model R.
Share : |

![]](/_files/images/data-interpretation/common/15-sym-cbracket-h1.gif)

