


Bar Charts - General Aptitude
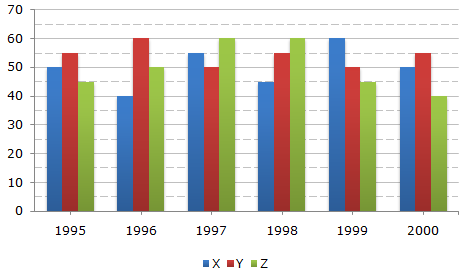
A soft drink company prepares drinks of three different flavours - X, Y and Z. The production of three flavours over a period of six years has been expressed in the bar graph provided below.
Production of Three Different Flavours X, Y and Z by a Company over the years (in lakh bottles)
A 1996
B 1997
C 1998
D 1999
ANS:B - 1997 The percentage rise/fall in production from the previous year for flavour Y during various years are:
 Maximum change is decrease of 16.67% during 1997. Maximum change is decrease of 16.67% during 1997.
Share : |

![]](/_files/images/data-interpretation/common/15-sym-cbracket-h1.gif)

