Line Charts

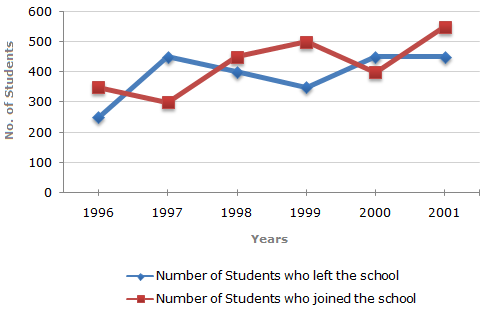
Study the following line graph which gives the number of students who joined and left the school in the beginning of year for six years, from 1996 to 2001.

Initial Strength of school in 1995 = 3000.

Q1: For which year, the percentage rise/fall in the number of students who left the school compared to the previous year is maximum?

A 1997

B 1998

C 1999

D 2000

ANS:A - 1997

The percentage rise/fall in the number of students who left the school (compared to the previous year) during various years are:

For 1997 = [ (450 - 250) x 100 ] % = 80% (rise).
250
For 1998 = [ (450 - 400) x 100 ] % = 11.11% (fall).
450
For 1999 = [ (400 - 350) x 100 ] % = 12.5% (fall).
400
For 2000 = [ (450 - 350) x 100 ] % = 28.57% (rise).
350
For 2001 = [ (450 - 450) x 100 ] % = 0%.
450
Clearly, the maximum percentage rise/fall is for 1997.


img not found
img

For help Students Orientation
Mcqs Questions

One stop destination for examination, preparation, recruitment, and more. Specially designed online test to solve all your preparation worries. Go wherever you want to and practice whenever you want, using the online test platform.