


Pie Charts - General Aptitude
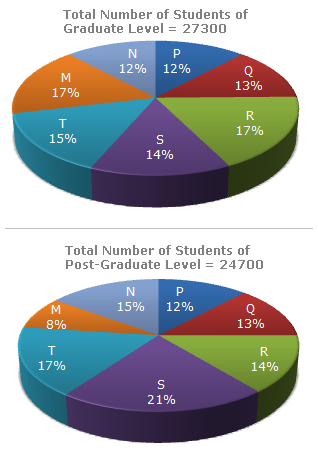
The following pie-charts show the distribution of students of graduate and post-graduate levels in seven different institutes in a town.
Distribution of students at graduate and post-graduate levels in seven institutes:
A
7516
B 8463
C
9127
D 9404
ANS:B - 8463 Students of institute M at graduate level= 17% of 27300 = 4641. Students of institute S at graduate level = 14% of 27300 = 3822.
Share : |
 Total number of students at graduate in institutes M and S
