- Pie Charts - Pie Chart 1
- Pie Charts - Pie Chart 2
- Pie Charts - Pie Chart 3
- Pie Charts - Pie Chart 4
- Pie Charts - Pie Chart 5
- Pie Charts - Pie Chart 6
- Pie Charts - Pie Chart 7
- Pie Charts - Pie Chart 8
- Pie Charts - Pie Chart 9
- Pie Charts - Pie Chart 10
- Pie Charts - Pie Chart 11
- Pie Charts - Pie Chart 12


Pie Charts - General Aptitude
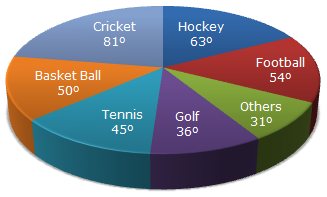
The circle-graph given here shows the spendings of a country on various sports during a particular year. Study the graph carefully and answer the questions given below it.
Q1: How much percent less is spent on Football than that on Cricket?A
B 27%
C
D
ANS:C -
Let the total spendings on sports be Rs. x. Then,
|


For help Students Orientation
Mcqs Questions
One stop destination for examination, preparation, recruitment, and more. Specially designed online test to solve all your preparation worries. Go wherever you want to and practice whenever you want, using the online test platform.