Line Charts

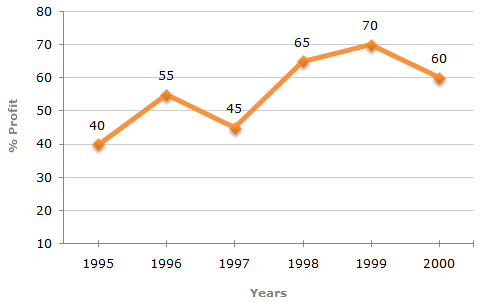
The following line graph gives the annual percent profit earned by a Company during the period 1995 - 2000.

Percent Profit Earned by a Company Over the Years.

%Profit = Income - Expenditure x 100
Expenditure

Q1: If the expenditures in 1996 and 1999 are equal, then the approximate ratio of the income in 1996 and 1999 respectively is?

A 1:1

B 2:3

C 13:14

D 9:10

ANS:D - 9:10

Let the expenditure in 1996 = x. Also, let the incomes in 1996 and 1999 be I1 and I2 respectively. Then, for the year 1996, we have:

55 = I1 - x x 100   =>   55 = I1 - 1   =>   I1 = 155x ... (i)
x 100 x 100
70 = I2 - x x 100   =>   70 = I2 - 1   =>   I2 = 170x ... (ii)
x 100 x 100
From (i) and (ii), we get:
    I1 =
( 155x )
100
= 155 => 0.91 => 9 : 10.
I2
( 170x )
100
170 1


img not found
img

For help Students Orientation
Mcqs Questions

One stop destination for examination, preparation, recruitment, and more. Specially designed online test to solve all your preparation worries. Go wherever you want to and practice whenever you want, using the online test platform.