- Line Charts - Line Chart 1
- Line Charts - Line Chart 2
- Line Charts - Line Chart 3
- Line Charts - Line Chart 4
- Line Charts - Line Chart 5
- Line Charts - Line Chart 6
- Line Charts - Line Chart 7
- Line Charts - Line Chart 8
- Line Charts - Line Chart 9
- Line Charts - Line Chart 10


Line Charts - General Aptitude
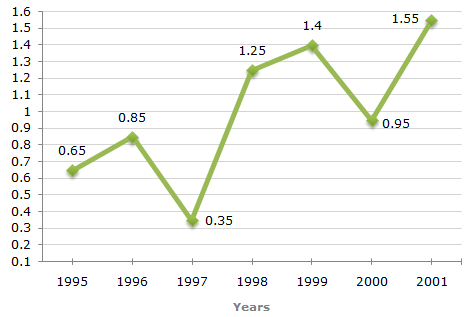
The following line graph gives the ratio of the amounts of imports by a company to the amount of exports from that company over the period from 1995 to 2001.
Ratio of Value of Imports to Exports by a Company Over the Years.
Q1: If the imports of the company in 1996 was Rs. 272 crores, the exports from the company in 1996 was ?A Rs. 370 crores
B
Rs. 320 crores
C
Rs. 280 crores
D Rs. 275 crores
ANS:B - Rs. 320 crores Ratio of imports to exports in the year 1996 = 0.85. Let the exports in 1996 = Rs. x crores.
![]() |


For help Students Orientation
Mcqs Questions
One stop destination for examination, preparation, recruitment, and more. Specially designed online test to solve all your preparation worries. Go wherever you want to and practice whenever you want, using the online test platform.