


Bar Charts - General Aptitude
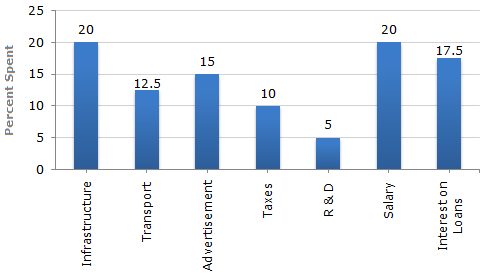
The bar graph given below shows the percentage distribution of the total expenditures of a company under various expense heads during 2003.
Percentage Distribution of Total Expenditure of a Company
A
Rs. 7 crores
B
Rs. 5.4 crores
C
Rs. 4.2 crores
D
Rs. 3 crores
ANS:C - Rs. 4.2 crores Let the total expenditure be Rs. x crores.
Then, 17.5% of x = 2.45 Share : |
 x = 14.
 Total expenditure = Rs. 14 crores.
and so, the total expenditure on advertisement, taxes and Research and Development
= Rs. [(15 + 10 + 5)% of 14] crores
= Rs. [30% of 14] crores
= Rs. 4.2 crores.
Total expenditure = Rs. 14 crores.
and so, the total expenditure on advertisement, taxes and Research and Development
= Rs. [(15 + 10 + 5)% of 14] crores
= Rs. [30% of 14] crores
= Rs. 4.2 crores.

