


Pie Charts - General Aptitude
Study the following pie-chart and the table and answer the questions based on them.
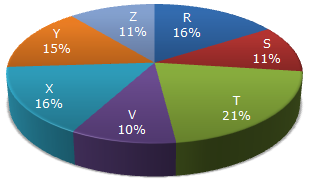
Proportion of Population of Seven Villages in 1997
| Village | % Population Below Poverty Line |
| X | 38 |
| Y | 52 |
| Z | 42 |
| R | 51 |
| S | 49 |
| T | 46 |
| V | 58 |
A 14100
B 15600
C 16500
D
17000
ANS:B - 15600 Population of village R = 32000 (given). Let the population of village Y be y.
 Population of village Y below poverty line = 52% of 30000 = 15600. Population of village Y below poverty line = 52% of 30000 = 15600.
Share : |
 y =
y =


