


Table Charts - General Aptitude
Study the following table and answer the questions based on it.
Expenditures of a Company (in Lakh Rupees) per Annum Over the given Years.
| Year | Item of Expenditure | ||||
| Salary | Fuel and Transport | Bonus | Interest on Loans | Taxes | |
| 1998 | 288 | 98 | 3.00 | 23.4 | 83 |
| 1999 | 342 | 112 | 2.52 | 32.5 | 108 |
| 2000 | 324 | 101 | 3.84 | 41.6 | 74 |
| 2001 | 336 | 133 | 3.68 | 36.4 | 88 |
| 2002 | 420 | 142 | 3.96 | 49.4 | 98 |
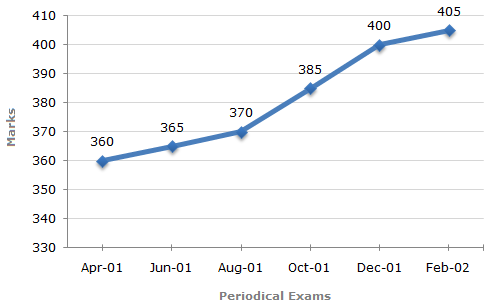
Q1: In a school the periodical examination are held every second month. In a session during April 2001 - March 2002, a student of Class IX appeared for each of the periodical exams. The aggregate marks obtained by him in each perodical exam are represented in the line-graph given below.
Marks Obtained by student in Six Periodical Held in Every Two Months During the Year in the Session 2001 - 2002.
Maximum Total Marks in each Periodical Exam = 500
|
| 65 = | 3x - E1 | x 100  |
65 | = | 3x | - 1 E1 = 3x x |
 |
100 |  |
.... (i) |
| E1 | 100 | E1 | 165 |
B
| 50 = | 4x - E2 | x 100 |
50 | = | 4x | - 1 E2 = 4x x |
|
100 | |
.... (ii) |
| E2 | 100 | E2 | 150 |
C
| E1 | = |
|
= | 3 x 150 | = | 15 | (Required ratio). | |||||
| E2 |
|
4 x 165 | 22 |
D
| Then, 35 = | x - 220 | x 100 x = 297. |
| 220 |
ANS:A -
| 65 = | 3x - E1 | x 100 |
65 | = | 3x | - 1 E1 = 3x x |
|
100 | |
.... (i) |
| E1 | 100 | E1 | 165 |
Let the incomes in 2000 of Companies X and Y be 3x and 4x respectively. And let the expenditures in 2000 of Companies X and Y be E1 and E2 respectively. Then, for Company X we have:
| 65 = | 3x - E1 | x 100 |
65 | = | 3x | - 1 E1 = 3x x |
|
100 | |
.... (i) |
| E1 | 100 | E1 | 165 |
| 50 = | 4x - E2 | x 100 |
50 | = | 4x | - 1 E2 = 4x x |
|
100 | |
.... (ii) |
| E2 | 100 | E2 | 150 |
| E1 | = |
|
= | 3 x 150 | = | 15 | (Required ratio). | |||||
| E2 |
|
4 x 165 | 22 |
Share :

