


Line Charts - General Aptitude
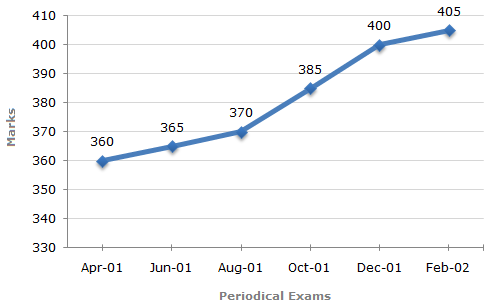
In a school the periodical examination are held every second month. In a session during April 2001 - March 2002, a student of Class IX appeared for each of the periodical exams. The aggregate marks obtained by him in each perodical exam are represented in the line-graph given below.
Marks Obtained by student in Six Periodical Held in Every Two Months During the Year in the Session 2001 - 2002.
Maximum Total Marks in each Periodical Exam = 500
A
June, 01
B
August, 01
C Oct, 01
D Dec, 01
ANS:C - Oct, 01 Percentage increase in marks in various periodical exams compared to the previous exams are:
Share : |

![]](/_files/images/data-interpretation/common/15-sym-cbracket-h1.gif)

