


Line Charts - General Aptitude
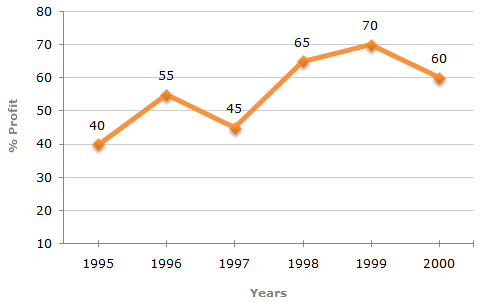
The following line graph gives the annual percent profit earned by a Company during the period 1995 - 2000.
Percent Profit Earned by a Company Over the Years.
| %Profit = | Income - Expenditure | x 100 |
| Expenditure |
A 2000
B 1997
C 1996
D
Cannot be determined
ANS:D - Cannot be determined The line-graph gives the comparison of percent profit for different years bu the comparison of the expenditures is not possible without more data. Therefore, the year with minimum expenditure cannot be determined. Share : |

