- Bar Charts - Bar Chart 1
- Bar Charts - Bar Chart 2
- Bar Charts - Bar Chart 3
- Bar Charts - Bar Chart 4
- Bar Charts - Bar Chart 5
- Bar Charts - Bar Chart 6
- Bar Charts - Bar Chart 7
- Bar Charts - Bar Chart 8
- Bar Charts - Bar Chart 9
- Bar Charts - Bar Chart 10
- Bar Charts - Bar Chart 11
- Bar Charts - Bar Chart 12
- Bar Charts - Bar Chart 13
- Bar Charts - Bar Chart 14
- Bar Charts - Bar Chart 15
- Bar Charts - Bar Chart 16
- Bar Charts - Bar Chart 17
- Bar Charts - Bar Chart 18
- Bar Charts - Bar Chart 19


Bar Charts - General Aptitude
Study the bar chart and answer the question based on it.
Production of Fertilizers by a Company (in 1000 tonnes) Over the Years
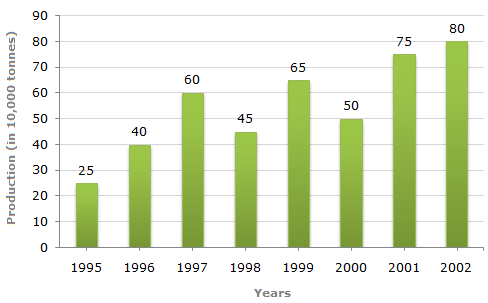
Q1: In which year was the percentage increase in production as compared to the previous year the maximum?A 2002
B 2001
C 1997
D 1996
ANS:D - 1996 The percentage increase in production compared to previous year for different years are:
|


For help Students Orientation
Mcqs Questions
One stop destination for examination, preparation, recruitment, and more. Specially designed online test to solve all your preparation worries. Go wherever you want to and practice whenever you want, using the online test platform.