- Bar Charts - Bar Chart 1
- Bar Charts - Bar Chart 2
- Bar Charts - Bar Chart 3
- Bar Charts - Bar Chart 4
- Bar Charts - Bar Chart 5
- Bar Charts - Bar Chart 6
- Bar Charts - Bar Chart 7
- Bar Charts - Bar Chart 8
- Bar Charts - Bar Chart 9
- Bar Charts - Bar Chart 10
- Bar Charts - Bar Chart 11
- Bar Charts - Bar Chart 12
- Bar Charts - Bar Chart 13
- Bar Charts - Bar Chart 14
- Bar Charts - Bar Chart 15
- Bar Charts - Bar Chart 16
- Bar Charts - Bar Chart 17
- Bar Charts - Bar Chart 18
- Bar Charts - Bar Chart 19


Bar Charts - General Aptitude
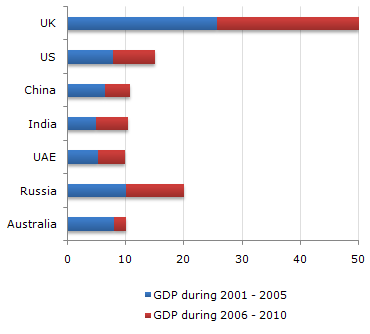
The following bar chart represents the GDP of different countries during the half decades 2001 - 2005 and 2006 - 2010. All figures are in Rs. billion.
GDP of Various Countries
Q1: Out of every Rs. 10,000 spent during the decade 2001 - 2010 approximately how much was the GDP of Russia during the half decade 2001 - 2005 ?A
Rs. 700
B Rs. 1,400
C Rs. 2,800
D
None of these
ANS:D - None of these Russia will account for 10 out of 125, i.e, 8% of the total, i.e, 800 out of 10,000 (approximately values based on visual interpretation). |


For help Students Orientation
Mcqs Questions
One stop destination for examination, preparation, recruitment, and more. Specially designed online test to solve all your preparation worries. Go wherever you want to and practice whenever you want, using the online test platform.