


Line Charts - General Aptitude
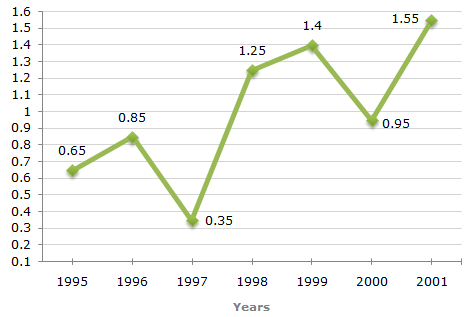
The following line graph gives the ratio of the amounts of imports by a company to the amount of exports from that company over the period from 1995 to 2001.
Ratio of Value of Imports to Exports by a Company Over the Years.
A 1995
B 1996
C 1997
D 2000
ANS:C - 1997 The imports are minimum proportionate to the exports implies that the ratio of the value of imports to exports has the minimum value. Now, this ratio has a minimum value 0.35 in 1997, i.e., the imports are minimum proportionate to the exports in 1997. Share : |

