


Line Charts - General Aptitude
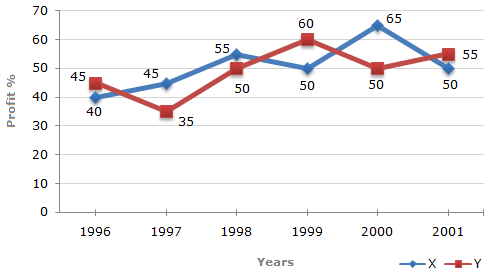
The following line graph gives the percent profit earned by two Companies X and Y during the period 1996 - 2001.
Percentage profit earned by Two Companies X and Y over the Given Years
| %Profit = | Income - Expenditure | x 100 |
| Expenditure |
A 7:22
B 14:19
C 15:22
D
27:35
ANS:C - 15:22 Let the incomes in 2000 of Companies X and Y be 3x and 4x respectively. And let the expenditures in 2000 of Companies X and Y be E1 and E2 respectively. Then, for Company X we have:
Share : |


