


Bar Charts - General Aptitude
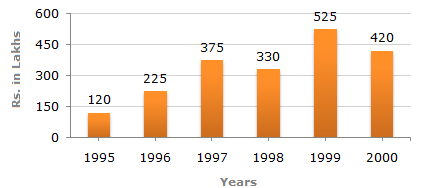
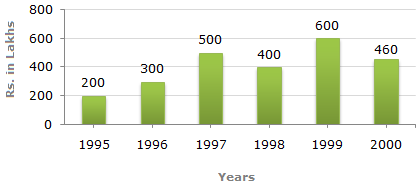
Out of the two bar graphs provided below, one shows the amounts (in Lakh Rs.) invested by a Company in purchasing raw materials over the years and the other shows the values (in Lakh Rs.) of finished goods sold by the Company over the years.
Amount invested in Raw Materials (Rs. in Lakhs)
Value of Sales of Finished Goods (Rs. in Lakhs)
A 1995
B 1996
C 1997
D 1998
ANS:C - 1997 The differences between the amount invested in raw material and the value of sales of finished goods for various years are: For 1995 = Rs. (200 - 120) lakhs = Rs. 80 lakhs. For 1996 = Rs. (300 - 225) lakhs = Rs. 75 lakhs. For 1997 = Rs. (500 - 375) lakhs = Rs. 125 lakhs. For 1998 = Rs. (400 - 330) lakhs = Rs. 70 lakhs. For 1999 = Rs. (600 - 525) lakhs = Rs. 75 lakhs. For 2000 = Rs. (460 - 420) lakhs = Rs. 40 lakhs. Clearly, maximum difference was during 1997. Share : |

