- Line Charts - Line Chart 1
- Line Charts - Line Chart 2
- Line Charts - Line Chart 3
- Line Charts - Line Chart 4
- Line Charts - Line Chart 5
- Line Charts - Line Chart 6
- Line Charts - Line Chart 7
- Line Charts - Line Chart 8
- Line Charts - Line Chart 9
- Line Charts - Line Chart 10


Line Charts - General Aptitude
Study the following line graph and answer the questions based on it.
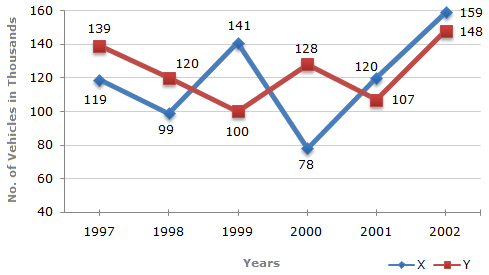
Number of Vehicles Manufactured by Two companies ove the Years (Number in Thousands)
Q1: The production of Company Y in 2000 was approximately what percent of the production of Company X in the same year ?A 173
B 164
C 132
D 97
ANS:B - 164
|


For help Students Orientation
Mcqs Questions
One stop destination for examination, preparation, recruitment, and more. Specially designed online test to solve all your preparation worries. Go wherever you want to and practice whenever you want, using the online test platform.