


Line Charts - General Aptitude
Initial Strength of school in 1995 = 3000.
A 1.2%
B
1.7%
C
2.1%
D
2.4%
ANS:B - 1.7%
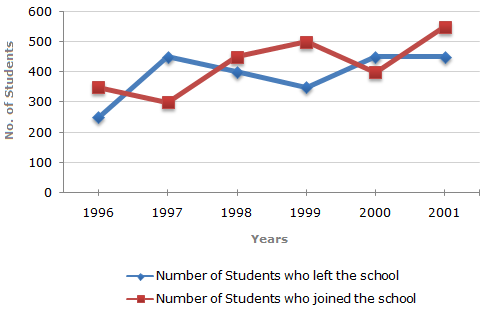
Important data noted from the given graph: In 1996 : Number of students left = 250 and number of students joined = 350. In 1997 : Number of students left = 450 and number of students joined = 300. In 1998 : Number of students left = 400 and number of students joined = 450. In 1999 : Number of students left = 350 and number of students joined = 500. In 2000 : Number of students left = 450 and number of students joined = 400. In 2001 : Number of students left = 450 and number of students joined = 550. Therefore, the numbers of students studying in the school (i.e., strength of the school) in various years: In 1995 = 3000 (given). In 1996 = 3000 - 250 + 350 = 3100. In 1997 = 3100 - 450 + 300 = 2950. In 1998 = 2950 - 400 + 450 = 3000. In 1999 = 3000 - 350 + 500 = 3150. In 2000 = 3150 - 450 + 400 = 3100. In 2001 = 3100 - 450 + 550 = 3200.
Share : |

![]](/_files/images/data-interpretation/common/15-sym-cbracket-h1.gif)
 1.7%.
1.7%.
