


Line Charts - General Aptitude
Study the following line graph and answer the questions based on it.
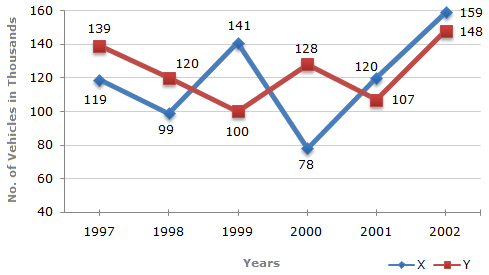
Number of Vehicles Manufactured by Two companies ove the Years (Number in Thousands)
A 19000
B
22000
C
26000
D
28000
ANS:C - 26000 From the line-graph it is clear that the productions of Company X in the years 1997, 1998, 1999, 2000, 2001 and 2002 are 119000, 99000, 141000, 78000, 120000 and 159000 and those of Company Y are 139000, 120000,100000, 128000, 107000 and 148000 respectively. Total production of Company X from 1997 to 2002 = 119000 + 99000 + 141000 + 78000 + 120000 + 159000 = 716000. and total production of Company Y from 1997 to 2002 = 139000 + 120000 + 100000 + 128000 + 107000 + 148000 = 742000. Difference = (742000 - 716000) = 26000. Share : |

