- Pie Charts - Pie Chart 1
- Pie Charts - Pie Chart 2
- Pie Charts - Pie Chart 3
- Pie Charts - Pie Chart 4
- Pie Charts - Pie Chart 5
- Pie Charts - Pie Chart 6
- Pie Charts - Pie Chart 7
- Pie Charts - Pie Chart 8
- Pie Charts - Pie Chart 9
- Pie Charts - Pie Chart 10
- Pie Charts - Pie Chart 11
- Pie Charts - Pie Chart 12


Pie Charts - General Aptitude
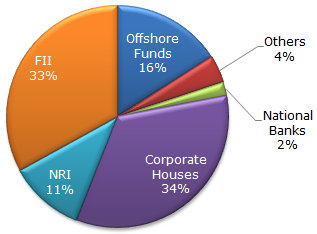
The following pie chart shows the amount of subscriptions generated for India Bonds from different categories of investors.
Subscriptions Generated for India Bonds
Q1: What percentage of the total investment is coming from FII's and NRI's ?A 33 %
B
11 %
C
44 %
D
22 %
ANS:C - 44 % (33 + 11) = 44 |


For help Students Orientation
Mcqs Questions
One stop destination for examination, preparation, recruitment, and more. Specially designed online test to solve all your preparation worries. Go wherever you want to and practice whenever you want, using the online test platform.