- Bar Charts - Bar Chart 1
- Bar Charts - Bar Chart 2
- Bar Charts - Bar Chart 3
- Bar Charts - Bar Chart 4
- Bar Charts - Bar Chart 5
- Bar Charts - Bar Chart 6
- Bar Charts - Bar Chart 7
- Bar Charts - Bar Chart 8
- Bar Charts - Bar Chart 9
- Bar Charts - Bar Chart 10
- Bar Charts - Bar Chart 11
- Bar Charts - Bar Chart 12
- Bar Charts - Bar Chart 13
- Bar Charts - Bar Chart 14
- Bar Charts - Bar Chart 15
- Bar Charts - Bar Chart 16
- Bar Charts - Bar Chart 17
- Bar Charts - Bar Chart 18
- Bar Charts - Bar Chart 19


Bar Charts - General Aptitude
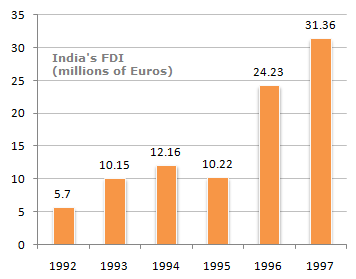
The following bar chart shows the trends of foreign direct investments(FDI) into India from all over the world.
Trends of FDI in India
Q1: What was absolute difference in the FDI to India in between 1996 and 1997 ?A 7.29
B
7.13
C 8.13
D None of these
ANS:B - 7.13 The difference in investments over 1996-1997 was 31.36 - 24.23 = € 7.13 millions. |


For help Students Orientation
Mcqs Questions
One stop destination for examination, preparation, recruitment, and more. Specially designed online test to solve all your preparation worries. Go wherever you want to and practice whenever you want, using the online test platform.