


Line Charts - General Aptitude
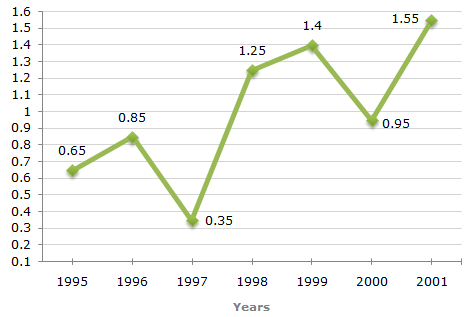
The following line graph gives the ratio of the amounts of imports by a company to the amount of exports from that company over the period from 1995 to 2001.
Ratio of Value of Imports to Exports by a Company Over the Years.
A 72
B 56
C 28
D
Data inadequate
ANS:D - Data inadequate The graph gives only the ratio of imports to exports for different years. To find the percentage increase in imports from 1997 to 1998, we require more details such as the value of imports or exports during these years. Hence, the data is inadequate to answer this question. Share : |

