- Bar Charts - Bar Chart 1
- Bar Charts - Bar Chart 2
- Bar Charts - Bar Chart 3
- Bar Charts - Bar Chart 4
- Bar Charts - Bar Chart 5
- Bar Charts - Bar Chart 6
- Bar Charts - Bar Chart 7
- Bar Charts - Bar Chart 8
- Bar Charts - Bar Chart 9
- Bar Charts - Bar Chart 10
- Bar Charts - Bar Chart 11
- Bar Charts - Bar Chart 12
- Bar Charts - Bar Chart 13
- Bar Charts - Bar Chart 14
- Bar Charts - Bar Chart 15
- Bar Charts - Bar Chart 16
- Bar Charts - Bar Chart 17
- Bar Charts - Bar Chart 18
- Bar Charts - Bar Chart 19


Bar Charts - General Aptitude
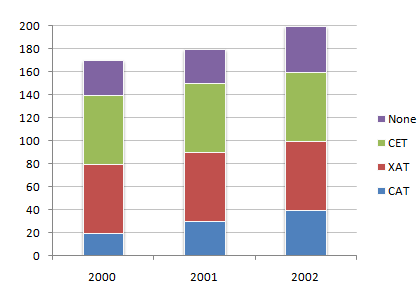
The following chart represents the number of students who passed the CAT exam or the XAT exam or the CET exam or None of these exams. (Assume that there are no students who passed more than one exam.)
Number of students who qualified CAT/XAT/CET Exams
Q1: What was the percentage of students who succeeded in at least one of three exams in 2000 ?A
82.4 %
B 82.8 %
C 82.35 %
D 83.3 %
ANS:C - 82.35 % Total percentage of students who succeeded in at least one of three exams in 2000 = (140 x 100)/170 = 82.35 % |


For help Students Orientation
Mcqs Questions
One stop destination for examination, preparation, recruitment, and more. Specially designed online test to solve all your preparation worries. Go wherever you want to and practice whenever you want, using the online test platform.